
Bristol's Flag War: When the Crime Data Destroys Your "Community Safety" Narrative.
Thre maps reveal affluent Green-controlled Central ward has 10x the crime of deprived Labour wards targeted for flag removal. Council claims "community safety" while ignoring its own city centre crime

Sometimes you don’t need leaked documents. Sometimes four publicly available data sets nobody bothered to cross-reference tell you everything about who’s actually running your city and who’s getting the sharp end.
Bristol’s flag controversy—Union Jacks on lampposts, 1,600 petitioners demanding removal, council pledging they’ll “gradually disappear”—looks like standard culture war theatre. Except when you map deprivation against elections against flags against crime statistics, what emerges is a city governed by people insulated from consequences, imposed on people experiencing the failure, justified through claims the actual data proves are total rubbish.
Here’s the receipts.
What Three Maps Actually Show.
(Above images: from www.bristol-uncovered.uk)
(image: Bristol City Council)
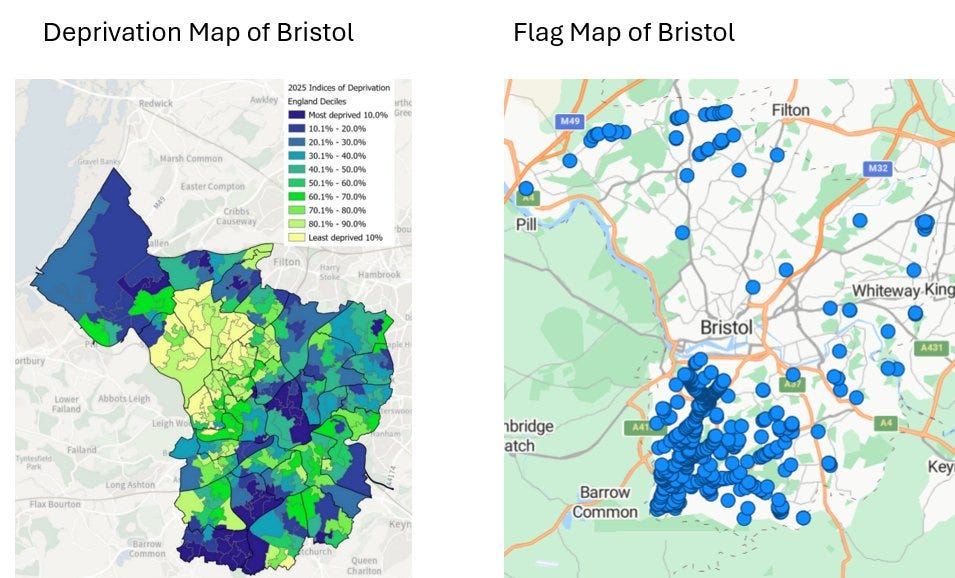
Bristol City Council’s 2019 Index of Multiple Deprivation: deep purple (most deprived 10-30% in England) rings the outer edges. Bright yellow (least deprived 10%) sits in the centre. The three most deprived wards: Hartcliffe & Withywood, Lawrence Hill, Filwood. One in four people in Hartcliffe struggle financially. This is England’s top 100 most deprived areas.
Union Jack displays? Cluster almost exclusively in those purple zones. Hartcliffe, Filwood, Southmead, Horfield. Working-class areas getting shafted hardest.
The affluent yellow centre—Clifton, Redland, Cotham, the Victorian townhouses and Tesla charging points? No flags. Don’t feel the need.
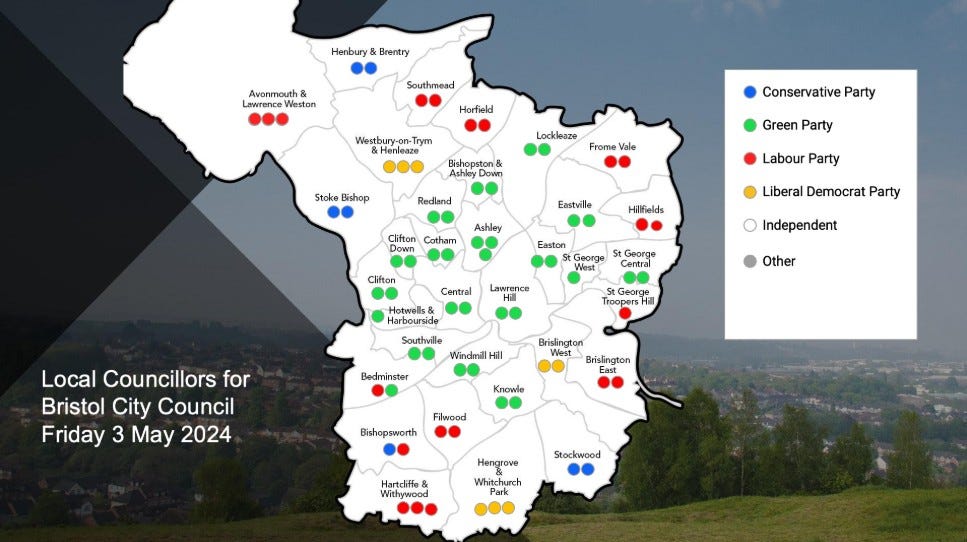
Now add May 2024 election results.
Affluent centre went Green. Flag-flying deprived areas went Labour. Greens also won gentrifying inner-city spots like Lawrence Hill and Ashley—younger demographics, transient populations who’ll move on before consequences land.
Bristol’s governing coalition: Green councillors representing either wealthy progressives who’ll never experience policy impacts, or gentrifying areas with populations that’ll scarper. Making decisions imposed on Labour-voting working-class communities who’ve got no governing power despite electing councillors.
The flags aren’t patriotism. They’re territorial markers in wards that correctly understand they’re being governed against.
Who Actually Feels “Unsafe”?
January 2026: 1,600 residents petition for flag removal. Flags are “insidiously racist,” make people feel “intimidated, scared, and unwelcome.”
Liberal Democrat Councillor Stephen Williams agrees. Flags come down where they “cause distress” or make the city “look unsightly.”
Petition signatures from Bedminster and gentrifying zones—newer middle-class arrivals uncomfortable with working-class identity markers. Duckmoor Road resident Cian Rance: flags are “insidiously racist” and make people “scared and unwelcome.”
Strong words. “Unsafe.” “Intimidated.” “Scared.”
So I checked the crime statistics.
The Crime Data Nobody Mentioned.
November 2025: 6,376 reported crimes across Bristol, mapped to neighbourhoods of roughly 1,500 people.
Top crime locations:
Castle Park (Central ward) - 297 crimes
The Centre (Central ward) - 185 crimes
St James Barton (Central ward) - 183 crimes
Park Row (Central ward) - 97 crimes
Queens Square (Central ward) - 82 crimes
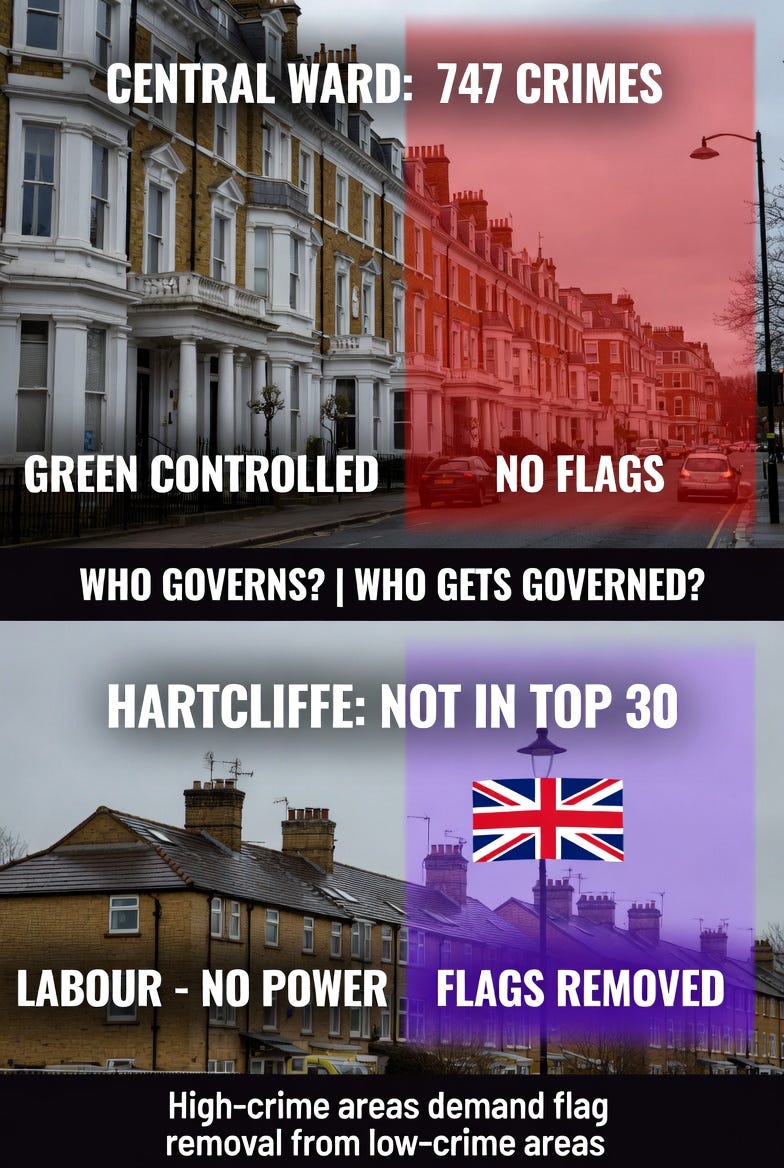
Central ward—the affluent Green-controlled city centre, that yellow “least deprived” zone—contains five of the top eight highest-crime locations. 747 crimes in one month. Bristol’s wealthiest core. No flags. Just the highest crime concentration in the entire city.
Flag-flying Labour wards:
Hartcliffe & Withywood (Bristol’s #1 most deprived, heavy flags): doesn’t crack the top 30 for crime.
Filwood (#3 most deprived, Labour, flags): not in top 30.
Southmead (deprived Labour, flags): 85 crimes—far below the affluent centre.
Bedminster East—where petition organiser Cian Rance lives and tells the council flags make people “scared and unwelcome in their own neighbourhoods”—recorded 79 crimes in November. Higher than any single location in Hartcliffe & Withywood, the ward he’s targeting for flag removal to improve his “community safety.”
The people claiming flags make them feel unsafe live in areas with measurably higher crime than the communities they’re demanding have flags removed.
Is this practical? Is this logical? What’s the likely outcome?
The Pattern.
Greens govern from Clifton/Redland (affluent, high crime, no flags) plus gentrifying areas. Labour holds Hartcliffe/Filwood/Southmead (deprived, low crime, flags) but can’t govern.
What this produces:
The Green administration sells 1,222 council homes while promising to build 1,000 affordable annually—maths that doesn’t work even if you’re being generous with the definition of “affordable.” Sales hit Labour wards hardest. When “affordable” delivery actually happens, it lands in gentrifying Green wards like Ashley and Easton, where market rents already price out the people who’d have qualified for the council homes just sold off. Displacement by spreadsheet.
Transport schemes proceed despite 54% public opposition. That opposition concentrates in middle-income Labour areas where people need cars to get to actual jobs that start before the bus schedule kicks in—but the schemes get designed by Green voters cycling from Clifton townhouses to public sector jobs with flexible hours and working-from-home Fridays.
And now flags get removed using “community safety” justifications that the actual crime data proves are nonsense.
Every policy flows from those insulated from consequences to those experiencing sharpest failure.
What The Flags Actually Said.
Communities experiencing highest deprivation, voting Labour, having no governing power, seeing asset sales and policy impositions they oppose—put up flags. Not because they’re racist. Because asserting national identity was the only agency left. A visible claim to belonging when decision-makers live in different postcodes, vote different parties, experience different realities.
The flags said: “We’re still here. You can’t erase us.”
Response: 1,600 petitioners from higher-crime areas claimed symbols made them “unsafe.” Green administration from highest-crime areas agreed removal necessary for “community safety.” Flags will “gradually disappear” because they make affluent Bristol “look unsightly.”
What’s Measurable.
Strip the rhetoric. Here’s what data shows:
Official Crime Stats - Nov 2025.
Economic: Index of Multiple Deprivation proves entrenched poverty in specific wards.
Political: May 2024 results show most-deprived wards elected Labour councillors who can’t govern. Greens control via affluent progressives plus gentrifying areas.
Symbolic: Flags cluster in deprived Labour wards experiencing both economic failure and political disenfranchisement.
Crime: November 2025 police data shows affluent Green centre has far higher crime than deprived Labour periphery. Completely inverts “flags make us unsafe” narrative.
Governance: Housing sales, transport schemes, flag removal systematically impact communities with least power to resist.
This isn’t culture war. It’s class structure visualised across four data sets.
Flag-flyers correctly identified abandonment. Petition-signers correctly identified symbols challenging their Bristol vision. Council—governing from the latter’s interests—used moral language about safety to complete the erasure. Job done.
Nobody planned this. But system rules create predictable outcomes: affluent progressives vote values they’ll never face. Gentrifying areas vote aesthetics that won’t outlast their tenancy. Working-class areas vote material interests that no longer translate to power. Policies flow from Green base toward those outside it. Communities experiencing failure assert identity markers. Markers offend sensibilities. Removal justified through safety claims data contradicts.
Deterministic chaos.
The flags come down. The data remains. And Hartcliffe, Filwood, Southmead—highest deprivation, lowest crime, least governing power, most abandoned—will draw their own conclusions about what that means.
ACKNOWLEDGEMENT: Huge thanks to Chris @bristoluncovered #BristolUnc for his groundwork and inspiration. Without whom this article would never have been written.
SOURCES: Bristol City Council JSNA 2024/25 Deprivation; BCC Election Results May 2024; Bristol Live Jan 16 2026; Avon & Somerset Constabulary Nov 2025 Crime Data; BCC LSOA21 Population Estimates.
The Almighty Gob operates from an “anarch” position—institutional dysfunction observed with analytical detachment, no tribal loyalty. Specialises in Bristol accountability via FOI requests and policy analysis. Three questions applied to all claims: Is it practical? Is it logical? What’s the likely outcome?
The data doesn’t lie. The maps don’t lie. Whether anyone in power gives a damn what it reveals? Different question entirely.
Thanks for joining the dots in such a clear way. PS I am currently working on trying to track down the council properties that we have lost due to disposals and right to buy.