
When Bristol's Air Wasn't Bristol's Air.
Camden's numbers, borrowed for a headline. John Langley, The Almighty Gob — 28/07/2026

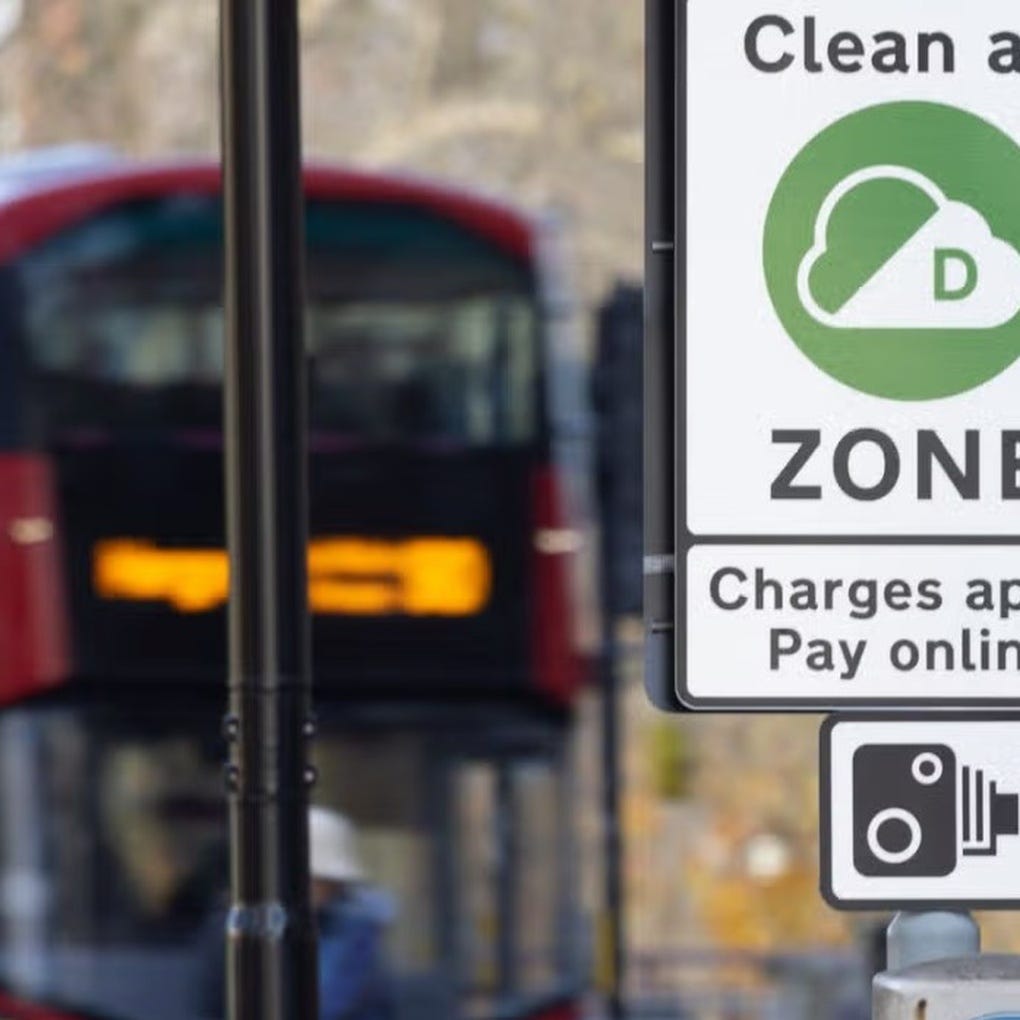
[Bristol Clean Air Zone road sign reading Charges Apply, Pay Online, with a red bus blurred in the background on a city centre street]
It was 09:08 on a Tuesday morning, and Bristol Post wanted me to know my city is dying by numbers. “Bristol is most polluted area in the South West,” the headline says, dressed with a photograph of a bus and a Bristol Clean Air Zone sign, as though the two things obviously belong together.
I instinctively knew something was wrong before I could say what. You’ve felt that too, haven’t you — the itch that arrives half a second ahead of the argument.
Well. Twenty-one micrograms of fine particulate matter. Thirty-four micrograms of nitrogen dioxide. The numbers so precise they sound like they were measured specifically for you, specifically here, specifically today.
They weren’t.
It must have been a slow news day in Bristol. That, or somebody decided the “Environment” piece could do with a fright before lunch.
Most people won’t read past that headline. They’ll see “Bristol is most polluted area in the South West,” feel the jolt, and repeat it as fact.
Some will do more than repeat it. A wrong number like this becomes ammunition — for anyone already looking for a reason to demand a bigger Clean Air Zone, or attack the one that exists, or prove the council is failing, or prove it’s covering something up. Nobody checks the source first. They reach for whatever backs up the argument they already wanted to have.
That’s the actual damage here — not a wrong figure sitting quietly in an “Environment” piece, but a wrong figure fuelling a fight that was never based on anything to begin with, dressed up by whoever needs it as evidence they never once verified.
By the way. A wrong number doesn’t stay wrong quietly. It goes to work.
This piece is for the people who won’t take my word for it either.
Same Numbers, Different City.
The same figures — 21 micrograms, 34 micrograms — belong to an area of Camden, London. Not Bristol. Camden.
Follow the trail and they turn up a third time too, propping up a Dumfries story in The Herald about a town centre four hundred miles away. Dumfries gets its own, different, local number — Camden’s 21 and 34 sit underneath it as borrowed national colour, doing exactly the same job it did in Bristol’s headline.
The sentences match too — identical wording on what PM2.5 does to lungs, identical wording on what NO2 does to airways, run under Bristol’s name as if somebody in Bristol had gone out and found it.
Nobody had.
You might wonder whether that’s coincidence — one city’s reading turning up twice more, down to the decimal. It isn’t. One figure, three towns, and only one of them is the town it was actually measured in.
Camden Was Never a Fair Comparison Anyway.
Set the recycled numbers aside for a moment. Even if Camden’s reading had been Bristol’s own, the comparison underneath the headline still wouldn’t hold up.
The Camden neighbourhood in question — Holborn, St Giles, Covent Garden — sits dead in the middle of the largest, densest, most continuously built-up city in Britain. No countryside starts a mile up the road. No motorway feeds it in from open fields. It’s wall-to-wall city in every direction for as far as London goes, which is a very long way.
To be clear. There is no version of Bristol that looks like that.
Bristol isn’t that. Bristol is a proper standalone city, with South Gloucestershire and North Somerset countryside on most of its edges, connected to everywhere else by the M4, M5 and M32 rather than sitting inside one unbroken conurbation.
You don’t need to understand a single microgram to see the problem. A patch of central London and a mid-sized city with fields on its boundary are not the same shape of place, and ranking them on one national scale as though they are is one more way this “story” flattens something that was never flat to begin with.
None of this makes Camden’s own reading any less real, or any less serious for the people breathing it. It just means Camden was never a fair stand-in for somewhere it isn’t.
Camden’s own employers clearly think the problem is real too — businesses across the borough have pledged to tackle air pollution there directly. That’s what a real local pollution problem gets: local people responding to it. Bristol got a recycled headline instead.
Scale doesn’t fare any better. Dumfries has a population of roughly 33,700. Bristol has very nearly half a million. One borrowed figure, sitting under headlines fifteen times apart in size, as if a market town and a city are the same kind of place too.
Bristol Had Its Own Data All Along.
Bristol Post’s own piece names Upper Montpelier as one of the country’s other pollution hotspots — a real Bristol neighbourhood, not a borrowed national figure.
Bristol City Council monitors nitrogen dioxide right there, at Montpelier High School. The 2024 reading: 36.6 micrograms. Close to Camden’s borrowed 34 — closer than the PM2.5 comparison ever got.
One roadside tube outside a school isn’t measured the same way as a modelled neighbourhood average, and this piece won’t pretend otherwise. It’s still Bristol’s own number, from Bristol’s own equipment, sitting closer to Camden’s than the story ever bothered to check.
That’s worth saying plainly, because the point here isn’t that the real number would have been boring. It’s that a genuine, sourced, Bristol-specific reading was sitting inside the same council document Bristol Post never opened, and Camden’s got used instead.
Nobody had to invent a scarier number. Bristol already had one. Nobody looked.
The Byline That Travels.
Annie Gouk’s name turns up across the Reach network on this exact species of piece — a national dataset, dropped into a template, localised only by which town gets plugged into the headline.
None of this is a complaint about one journalist. It’s what the production line looks like when a national data desk services dozens of local outlets on the same day, and nobody downstream has the time, or the brief, to check whether the number under the local headline was actually measured locally.
Recycling a national dataset isn’t the offence here — every regional title does that, and there’s nothing wrong with it. Presenting one city’s number as though it belongs to another, with nothing to tell the reader otherwise, is.
This isn’t a Bristol Post reporter driving out to a monitoring station. It’s a wire story wearing a local coat, and the coat doesn’t fit.
There’s a word for this. Churnalism — press release copy laundered as journalism, with a Bristol dateline stitched on top.
What “Geographic Data Service” Actually Measures.
The dataset itself — Defra’s modelled background pollution, gridded at 1km resolution, smoothed into a three-year rolling average — measures something real. It doesn’t measure what the headline implies.
Grid squares don’t know your postcode.
“Background” is the word doing the quiet work here. This is ambient air across a grid square, not a roadside reading tied to any camera, any charge zone, any enforcement boundary. Air moves. It has never once respected a council boundary, and no dataset built to model it pretends otherwise — the pretending happens one step downstream, in the headline.
The Council’s Own Numbers Say Otherwise.
Here is the part that doesn’t need my opinion attached to it.
Bristol City Council’s own 2025 Annual Status Report — the document the council itself submits to central government — puts Bristol’s actual measured PM2.5 at 7.1 micrograms at the urban background site, 8.4 at the roadside site nearest a school.
Not twenty-one. Seven, and eight.
Both figures sit above the WHO‘s actual air quality guideline of 5 micrograms — worth saying plainly, since this isn’t a piece arguing Bristol’s air is clean. It’s a piece arguing Bristol’s air isn’t Camden’s. And while we’re checking primary sources: Bristol Post’s own piece tells readers WHO recommends no more than 15 micrograms of NO2. WHO’s real figure, set in 2021, is 10. They got their own yardstick wrong before they got Bristol wrong.
Anyone tempted to borrow these numbers to argue Bristol’s air is basically fine, or that the Clean Air Zone should be scrapped, is doing exactly what Bristol Post did — taking a figure out of its proper context and marching it wherever suits the argument. This piece isn’t ammunition for that fight either.
The same report shows nitrogen dioxide falling by 13.2% in the Clean Air Zone’s first year, then slowing to 4.7% the year after — with forty-three of the city’s monitoring sites moving in the wrong direction. (Forty-three, by the report’s own executive summary. Its body text two pages later says forty-four. A rounding gap in the council’s document, not ours.)
The council puts some of that slowdown down to weather and to roadworks disrupting traffic near two of the worst-affected sites, and fair enough — that caveat belongs here too. It doesn’t touch the headline figure. Seven and eight stay seven and eight, whatever the weather did.
And on the council’s own public figures, pollution outside the Clean Air Zone charges boundary has fallen almost as much as pollution inside it — 17% against 20%.
You’ve noticed the shape of that, haven’t you. A boundary that charges you money is not the same thing as a boundary the air agrees to observe.
Two different monitoring systems, run by two different bodies, measuring pollution two different ways. Nobody’s claiming those methods are interchangeable — they’re not. What matters is that every one of them, independently, lands nowhere near 21.
Where The Monitors Aren’t.
Bristol has two PM2.5 monitors in the entire city. Two.
One sits at St Pauls, and the council’s own report is explicit about what that site is: an “urban background” location, deliberately away from busy roads, chosen to represent general pollution levels over central Bristol rather than the worst of it. The other sits at Parson Street School — roadside, but not the roadside.
Colston Avenue recorded 48.7 micrograms of NO2 in 2024, the highest reading anywhere in the city. Rupert Street recorded 45.4. Neither has ever had a PM2.5 monitor.
None of this is an accusation of deliberate placement. A limited monitoring budget has to land somewhere, and it’s easier to believe this is where it happened to land than a conspiracy to hide bad news. What it does mean is this: nobody has ever measured the fine particulate reading at Bristol’s own worst-known pollution hotspots. The real worst-case figure for this city isn’t unknown by accident. It’s unknown because no monitor was ever put where the worst air already is.
The Verdict.
None of this required a source close to the council, a whistleblower, or a single phone call. It required opening the same document Bristol Post could have opened, reading the number on the page, and comparing it to the number in the headline.
That’s the whole difference between a newsroom and a copy-and-paste job dressed up as one.
Here’s the part that should sting the piece itself, not just its readers. “Bristol is most polluted area in the South West” collapses an entire city into a single number — the same move that put Camden’s reading under Bristol’s name in the first place. Applied honestly, that headline never described Bristol. At most, it described Upper Montpelier. One postcode standing in for a city ten times its size is the same trick borrowed from London, just turned on itself.
The Almighty Gob doesn’t run on outrage. It runs on the gap between what a headline claims and what the primary source actually says — and on a slow Tuesday in an “Environment” piece, that gap was wide enough to drive a diesel bus through.
09:08 in the morning, and something was wrong before I could say what. Now you know what it was. Camden’s air, borrowed for a Bristol headline, and nobody at Bristol Post checked the label before they hung it in the window.
Sources & Citations.
Primary evidence
Bristol Post — “Bristol is most polluted area in the South West”
AOL — “Most polluted neighbourhoods in UK revealed” (Camden figures)
The Herald — “Dumfries town centre air pollution levels exceed WHO safe limit”
The Standard — “Leading Camden employers in pledge to tackle air pollution in the borough”
Bristol City Council — 2025 Air Quality Annual Status Report
Bristol City Council — Air Quality (public page, CAZ inside/outside figures)
Entity references